| CIS 410 Spring 2001 Tasks as of Tuesday, May 15, 4:06 PM | ||||
| Task | Due | Name | Description | Pages |
| N | GPSSH Notes | I have posted my GPSSH notes on the Internet. They are at http://www.uvi.edu/cerit/hdoc/gpsshnotes.html please feel free to suggest corrections and additions. | GPSSH Notes | |
| 1 | Tue, 23-Jan | Goals | ||
| 2 | Thu, 25-Jan | Chp. 1 | Test the program by running GPSSH with the joebarb.gps program. Open the JOEBARB.LIS file with your favorite word processor, remove the portions that don't mean much, add the appropriate headers and add:
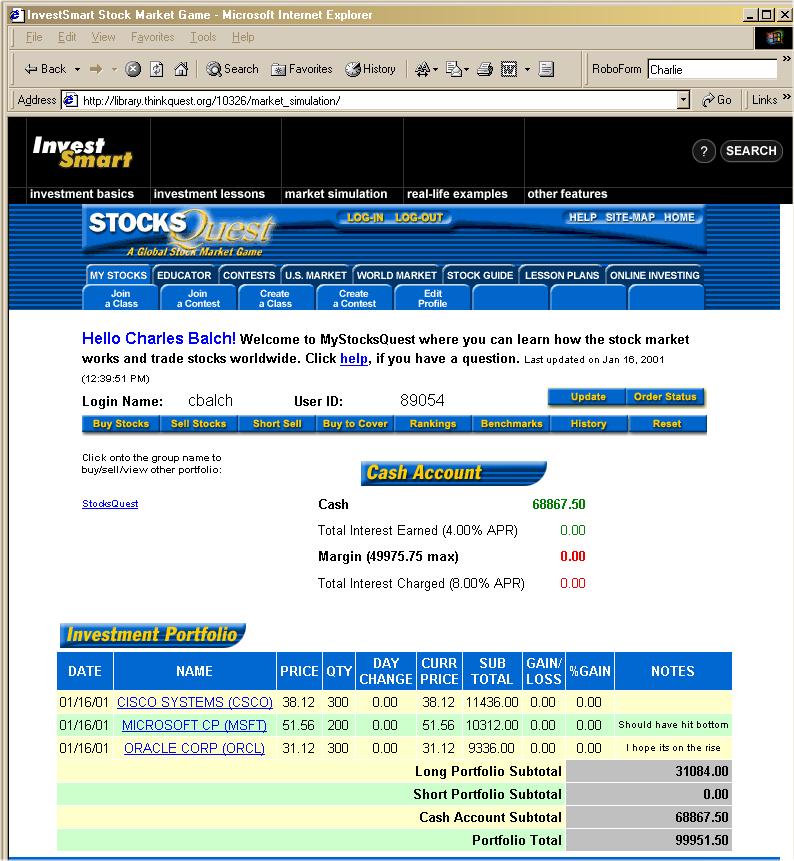
The document should be printed in Courier font and landscape format. It should fit on one page. Attach a separate page with a printout of your current stock portfolio in the simulation area.
| |
| 3 | Tue, 30-Jan | Chp. 2/3 | On page 2-11, for Section 2.5 (exercises) answer question 1 part a, b and c. Include a discussion on how the resources might become transactions in part b. On page 3-24, for the 3.11 exercises do problems 2 and 3. | |
| 4 | Tue, 6-Feb | Seize/Release | On page 3-24, for the 3.11 exercises do problems 6, 9, and 10. | |
| 5 | Thu, 8-Feb | Queue/Depart 1 | Redo problem 9 on page 3-27 to find out the average wait for the ticket purchasers and problems 4 and 6 on page 5-17. | |
| 6 | Tue, 13-Feb | Queue/Depart 2 | Do problem 1 on page 5-16. | |
| 7 | Thu, 15-Feb | Multiple Customers | For carnival parades, there are three types of patrons for a Maubi stand. Parade watchers arrive every four minutes plus or minus three minutes. Jouveut participants want a drink every three minutes plus or minus a minute. Parade Participants want a drink every half hour plus or minus a half hour. The parade lasts for three hours. You have been asked to calculate how fast a single servers must be to so that there will be an average of two people in line. Due to other people in the booth getting in the way and frequent breaks to say hello to passing friends, the server's time varies by plus or minus a minute. Highlight the average length of time that each type of customer waits. | |
| 8 | Tue, 27-Feb | Multiple Servers | Individual customers walk into a sit-down restaurant with a capacity of 50 persons every 8 +/- 3 minutes. It takes two +/- one minutes for them to approach the host. If there are seats available, it takes two minutes +/- two minutes to be sat. Once at the table, it takes a drink waiter five minutes +/- four minutes to get the drink order. The order takes five minutes +/- two minutes to be served. It then takes the food waiter five minutes +/- three minutes to take the food order. Food orders take twenty minutes +/- ten minutes to be served. (Meals may be made in parallel). Customers take forty-five minutes +/- fifteen minutes to consume their meal. It takes the food waiter five +/- five minutes to process the check. Over a five hour period, what is the peek occupancy? What is the average length of the line waiting to get in? What happens if there is only one waiter? What happens if there is two, three or four food waiters? | |
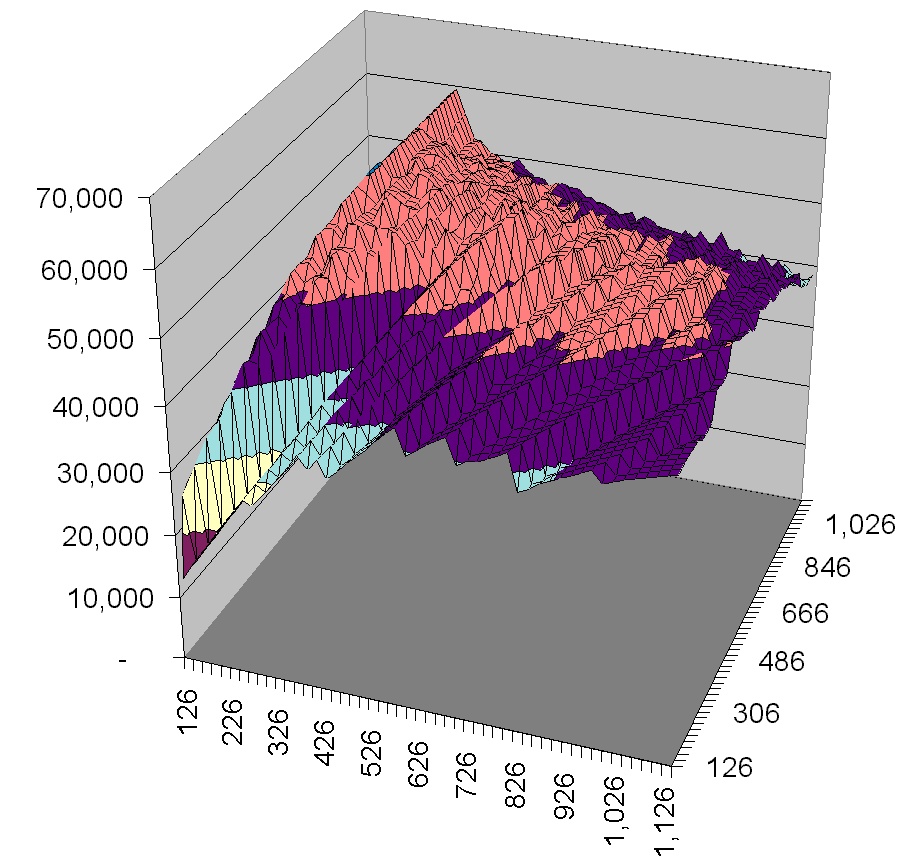
| 9 | Thu, 1-Mar | Pred/Prey | Assume that an island exists that has only two species of animals on it. There are hawks and mice. Hawks have no natural predators. The surviving hawks and mice from the previous month multiply with some birth rate. Each month some hawks and mice die natural deaths at some death rate. The sole source of food for the hawks is mice. Each month each hawk must eat a certain amount of mice in order to survive. Hawks and mice that can not eat enough die of starvation. Of those mice that do not die natural deaths some are eaten by the hawks. No matter how many hawks there are, some minimum percent of the mice that do not die natural deaths will survive hawk attacks due to survival instincts. The sole source of food for the mice is seeds. Mice that can not eat enough seeds die. The plants on the island produce seeds at a certain rate. You will receive unique values for the above situation. Graph the population values and state the relative population values once they have stabilized. | |
| 10 | Tue, 6-Mar | Cistern | Use the data in your email to figure out how many times water would have to be purchased given the parameters that your are supplied. What is the total amount of water fall? How much water was wasted. Answer the questions "how would a cistern twice and half the size change the number of water purchases." | Cistern Example |
| 11 | Tue, 27-Mar | Production | Use the SS at the right and insert the values for your own production information. Be sure to complete all scenarios. Your data under the name gradecode_production. | |
| 12 | Thu, 29-Mar | Projected Sales | View the projected sales graph image to the right then download the fincalc.exe spreadsheet. Use your data set in the homework area under the name "code_salestrends.html" to create a similar graph. Graph, summarize and discuss the data on a single Microsoft Word page. Be sure to predict what you think the next sales value will be. | |
| 13 | Tue, 3-Apr | ReDo Midterm | Download the sample programs that I posted next to the test area and place proper comments by all the lines. | |
| 14 | Thu, 5-Apr | advertising | The manager of a local store has calculated the returns on various kinds of customers using various types of advertising. She just received the latest cost of advertising and is asking you to calculate the best possible return. You need to calculate the net return of each type of advertising and decide which ones to use for optimal profit. | |
| 15 | Thu, 12-Apr | Cash Flows | Your boss is trying to decide which of two investments to make. There is only enough money for one alternative. You create a sheet similar to the example at the right using the numbers given at code_cashflow.html in the usual spot. Your boss takes one look at it and says "What do all those numbers mean?" For this task, use each of the possible methods shown to decide which, if either, project should be selected. Explain your choice and what the number means. At what interest rate would you break even on the other project? Include your completed spreadsheet but also a word processed discussion as described above. You may use the fincalc.exe to calculate your values. | |
| T2 | Tue, 1-May | Test 2 | Review the example to the right then use your data from code_savings.html to create a similar SS. I'm purposely not giving you the proper formulas as I want you to use help to find them. I will be checking your response for accurary. After you have calculated your values discuss them. Could you retire on these amounts? Re-examine your answer assuming 4% annual inflation. How would this effect your decision? | |
| U1 | Wed, 14-Mar | Project Update 1 | Be sure to follow the specification posted on the class page. You need to collect at least one hours worth of data and thirty customers. | |
| S | Solver Resources | Here are some useful solver resources. | ||
| FP | Final Project | Select a location where lines form and record customer frequency/count, time to serve and line length for two hours. Repeat your recordings on at least three days. Describe findings and use GPSSH to model your findings. Discuss how well the GPSSH model mimics Real Life Be sure to get permissions where appropriate. | ||
This table was created by a free Excel macro written by Charles Balch.
Here's the code. It is care ware - it's yours for free if do something nice for anyone (anyone includes you).